|
IPv6 Tunnel Performance
A.
Tunnel Brokers
In this section, we investigate the network
performance of IPv6 over tunnels by using the tunnel services from 3 tunnel
brokers; AARNet [14] in Australia, Euro6IX [15] in Europe
and Hexago/FreeNet6 in Canada [16].
While Euro6IX offers configured tunnelling
services, AARNet and FreeNet6 offer 6to4 tunnels
with automatic tunneling services [17].
B.
Connectivity of Tunnels
Table VI shows that the connectivity of all tunnels are
satisfactory, with all tunnel brokers showing over 90% reachability to the dual-stack sites. Among the
three, FreeNet6 performed the best, with over 95% reachability,
followed by Euro6IX, and then AARNet. However,
the Native-IPv6 connection still outperforms all of the tunneled-IPv6
connections.
Table
VI. Tunnel Connectivity Results
|
|
AARNet
|
Euro6IX
|
FreeNet6
|
NativeIPv6
|
|
Connectivity
|
92.52%
|
94.22%
|
95.91%
|
97.28%
|
C. Hop
Count of Tunnels
Figs. 9 and 10 show the hop count performance of the
three tunnel brokers. From our results, the average hop count for
tunneled-IPv6 paths through Euro6IX, AARNet and
FreeNet6 is 10.89, 14.36, 19.39 respectively,
while we have reported earlier
that the average hop count for Native-IPv6 paths is 15.22. These results
indicate that the hop count of tunneled- IPv6 paths are dependent on the
geographic locations of the tunnel brokers’ servers and their number
of direct links to the IPv6 backbone.
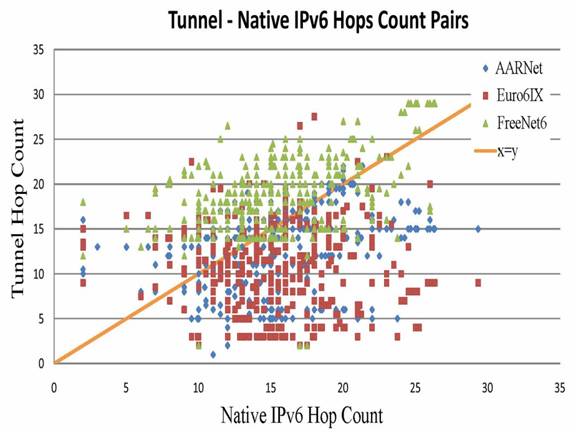
Fig.
9. Tunnel-Native IPv6 Hop Count Results
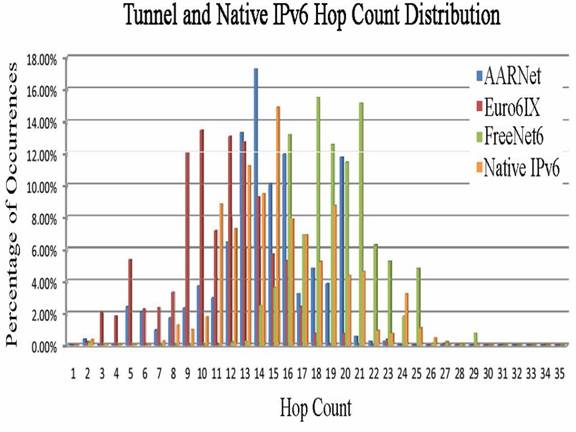
Fig.
10. Distribution of Tunnel-Native IPv6 Hop Count Results
D. RTT
of Tunnels
Figs. 11 and 12 show that while FreeNet6 has the best
RTT performance, Euro6IX has the worst RTT performance among the three
tunnel brokers, the opposite of the results reported for hop count of
tunnels. This phenomenon has also been observed earlier in the comparison of hop count
and RTT results for the Native-IPv6 vs. IPv4 performance, and in the
current tunnels test, this phenomenon is due to the differences in the link
accessibilities of the tunnel brokers’ servers to the dual-stack
sites in our tests. Figs. 11 and 12 also show that the RTTs
of tunneled-IPv6 paths are higher than those of Native-IPv6 paths. This is
due to the additional delays caused by the encapsulation and decapsulation operations entailed by the tunneling
process.
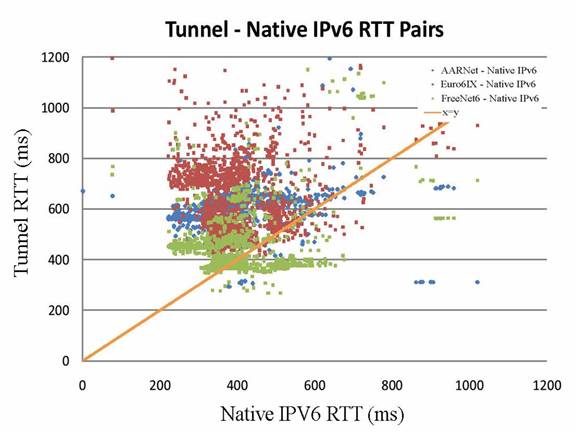
Fig. 11. Tunnel-Native IPv6
RTT Results
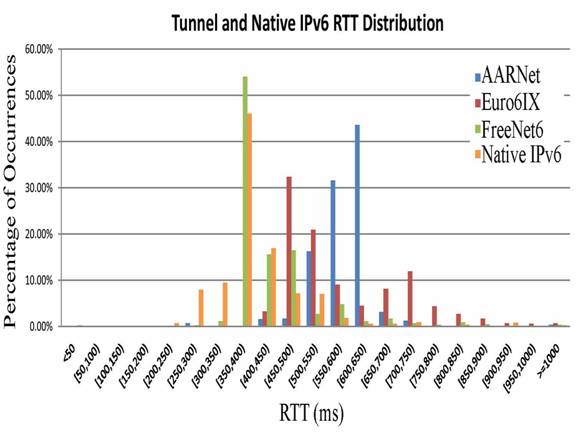
Fig.
12. Distribution of Tunnel-Native IPv6 RTT Results
E.
Throughput of Tunnels
Figs. 13 and 14 show that the throughput performance
of tunnels is similar to that of the RTT performance of tunnels, i.e.
FreeNet6 has the best throughput performance among the three tunnel
brokers. This is because the throughput of tunneled-IPv6 connections is
higher when the RTT is lower. Similarly, we see that the throughput
performance of Native-IPv6 connections is higher compared to that of
tunneled-IPv6 connections.
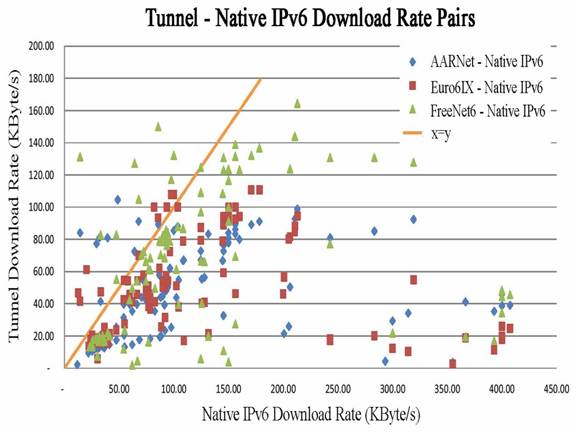
Fig.
13. Tunnel-Native IPv6 Throughput Results
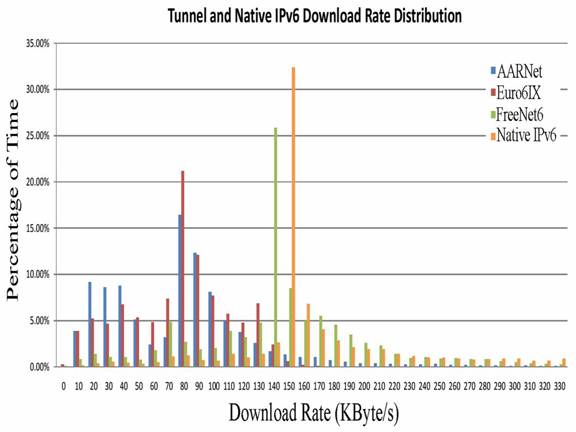
Fig.
14. Distribution of Tunnel-Native IPv6 Throughput Results
F.
Tunnel Performance Summary
We summarized the tunneled-IPv6 network performance
in Table VII where we see that FreeNet6 provides the best tunneled-IPv6
network performance. Even though its tunneled-IPv6 path has a higher hop
count, in RTT and throughput, FreeNet6 achieves 40% and 30% better
performance compared to AARNet and Euro6IX. Our
results also show that the network performance of tunneled-IPv6 connections
is nearly on par with that of Native-IPv6 connections.
Table
VII. Tunnel Performance Summary
|
Tests
|
AARNet
|
Euro6IX
|
FreeNet6
|
(Native-IPv6)
|
|
Connectivity
|
92.52%
|
94.22%
|
95.91%
|
97.28%
|
|
Hop Count
|
14.36
|
10.89
|
19.39
|
15.22
|
|
RTT (ms)
|
615.87
|
612.05
|
432.20
|
403.36
|
|
T’put (KB/s)
|
82.56
|
72.78
|
123.07
|
107.75
|
|